


Gun Ownership by State (2026 Statistics)
Report Highlights: Although rates of firearm ownership vary widely from state to state, American civilians own more firearms than civilians in any other country.
- Montana has the highest rate of reported household gun ownership at 66.3 per 100 residents.
- Wyoming (66.2 per 100), Alaska (64.5 per 100), Idaho (60.1 per 100), and West Virginia (58.5 per 100) have the highest rates of gun ownership in the U.S.
- Massachusetts and New Jersey have the fewest gun owners at only 14.7 per 100 residents.
Related Studies: Gun Facts in the U.S.: The Reality of Firearms in America | Why Do Americans Own Guns in 2025? The Complexity of Demographics and Gun Ownership | Percentage of Americans Owning Guns in 2026
Ammo.com provides accurate and reliable data on a variety of subjects. You can view the sources used in this article here.
- Buy All-American!
- Bring health and vitality back to your body with these non-transdermal patches
- Get your Vitamin B17 & Get 10% Off With Promo Code TIM
- How To Protect Yourself From 5G, EMF & RF Radiation - Use promo code TIM to save $$$
- The Very Best All-American Made Supplements On The Market
- Grab This Bucket Of Heirloom Seeds & Save with Promo Code TIM
- Here’s A Way You Can Stockpile Food For The Future
- Stockpile Your Ammo & Save $15 On Your First Order
- Preparing Also Means Detoxifying – Here’s One Simple Way To Detoxify
- The Very Best Chlorine Dioxide
- All-American, US Prime, High Choice Grass-Fed Beef with NO mRNA, hormones or antibiotics... ever!
Methodology
Gun ownership data in the U.S. are dependent on self-reporting surveys and purchase records, as no firearm registry exists for guns not regulated by the Bureau of Alcohol, Tobacco, Firearms and Explosives (ATF) per the National Firearms Act (NFA). The number of registered firearms in each state was sourced from the ATF’s 2024 Firearms Commerce in the United States report. Machine guns, shotguns, rifles, and weapons classified as “Any Other Weapon” were included. Suppressors and destructive devices were not.
State-level household ownership rates were sourced from the RAND Corporation, which compiled 51 nationally representative surveys conducted between 1980 and 2016. The Federal Bureau of Investigation maintains background check records in the National Instant Criminal Background Check System (NICS), which provides recent gun sales data. Rates were adjusted to produce more realistic sales totals and may undercount some state-level sales in which concealed-carry permit holders were exempt from federal background checks.
Pew Research Center and Gallup surveys were consulted for national individual ownership rates. Estimates in this report are based on household gun ownership due to data limitations, as comprehensive surveys only cover national firearm prevalence.
Firearm death rates are sourced from the CDC WONDER database, which provides complete data up to 2024. All death rates cited in this report cover 2018 to 2024, as 2025 data are incomplete at the time of writing.
Rates of Gun Ownership by State
According to RAND, Montana had the highest rate of gun ownership, with an estimated 66.3 per 100 adults living in a home with firearms as of 2016. Massachusetts and New Jersey shared the lowest rate, at 14.7 per 100 adults living in a home with firearms.4
More recent 2024 purchasing records indicate that Wyoming and Montana had the most sales (16.1 per 100 and 15.9 per 100, respectively), while Alaska (15.4 per 100), New Hampshire (13.3 per 100), and Oregon (13.2 per 100) led all remaining states in firearm sales. These data may indicate that state-level ownership rankings have shifted slightly.2
Gun Ownership by Country
The latest global ownership survey in 2017 suggests there are approximately 857 million civilian-owned firearms globally.1
The U.S. had the highest rate of civilian gun ownership at 120.5 firearms for every 100 civilians. Canada ranked second, with 34.7 firearms per 100 civilians, followed by Switzerland at 27.58. At 3.58 per 100, China had the fewest guns per capita among the countries ranked.
Note: This information is based on a survey provided to various world governments. It is only as accurate as the governments cared to make it, and omits nonparticipating governments.
Guns Per Person in the U.S.
Estimates based on a 2017 survey suggest there are 1.2 guns per person in the U.S. Accounting for elevated gun buying trends between 2020 and 2026, a more realistic estimate is 1.5 guns per person, or 1.79 guns per adult.1
These figures are calculated from NICS data and adjusted to approximate annual firearm purchases. An estimated 15.5 million guns were sold in 2025, representing a decline from the pandemic peak of 22.7 million in 2020.2
Recent surveys in 2024 and 2025 suggest that around 30% of Americans own guns, two-thirds of gun owners have more than one firearm, and the average gun owner has four to five guns. This suggests that Americans report owning approximately 293 million firearms; a figure that undercounts the more realistic total estimated from NICS data.3, 7 For more on who’s behind those numbers, see our breakdown of how many gun owners are in America.
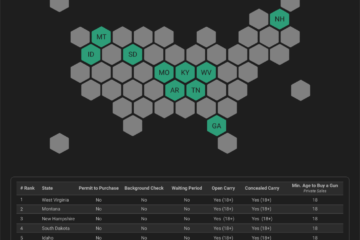
How Permits-to-Purchase and Background Checks Affect Gun Ownership
As of 2026, 15 states require permits or licenses to purchase firearms. Despite these requirements, ownership and purchasing rates remained high in 2024.6
Oregon had the fifth most sales in 2024, with 132.2 guns purchased per 1,000 residents. Michigan (63.9 sales per 1,000 residents) and Minnesota (72.4 sales per 1,000 residents) also ranked high in gun purchases.2, 4 For how these rules track with public-safety outcomes, see our analysis of gun laws vs. crime rates.
Which State Has the Most Registered Guns?
Because conventional firearms aren’t registered, there is no reliable count of how many total guns each state has. The only state-level registration data available comes from the ATF, which tracks firearms regulated under the NFA. Texas (188,805 registered guns), Florida (145,889), and Georgia (100,958) are the three states with the most registered NFA guns.5
Hawaii (729), Rhode Island (1,182), and Delaware (2,263) have the fewest registered firearms of all 50 states.
Cumulative purchasing estimates between 2015 and 2024 suggest that Texas (13.4 million), Florida (11.2 million), California (9.3 million), and Georgia (3.9 million) are states with the most guns (including conventional firearms). Hawaii was excluded due to missing NICS sales data, but it’s improbable the state had more firearm sales than the aforementioned.2
Percentage of Gun Ownership by State
At 66.3% of their households, Montana adults report the highest percentage of residential gun ownership. Massachusetts and New Jersey have the lowest percentage at 14.7%.4
Averaged across all states, RAND’s state-level estimates suggest that over 36% of the adult U.S. population lives in a household with a firearm. However, national surveys report lower individual ownership rates of 31-32%.3, 7
Firearm Ownership and Death Rate by State
Reported firearm-related deaths in the U.S. are largely inflated by suicides. States with higher household ownership rates also tend to have high suicide rates. Some outlier states, such as Hawaii and Mississippi, suggest that firearm access isn’t necessarily a contributing factor to firearm death.
Firearm prevalence and homicide rates do not show a strong correlation. Illinois, for example, has lower ownership rates than Montana and Wyoming, but higher homicide rates.
Firearm Ownership and Firearm-Related Deaths
Between 2018 and 2024, Alabama, Louisiana, Mississippi, New Mexico, and Wyoming had the highest average gun-death rate of 24.9 per 100,000 people. These states report an average household gun ownership rate of 55.4 per 100 residents.4, 8
Massachusetts, New Jersey, Hawaii, Rhode Island, and New York report the lowest average rates (15.8 per 100), with 4.48 firearm-related deaths per 100,000.4, 8
Firearm Ownership and Suicide Rate
Alaska, Colorado, Montana, New Mexico, and Wyoming had the highest suicide rates, averaging 26.4 deaths per 100,000 people between 2018 and 2024. These states report an average household ownership rate of 57.7 per 100 residents.4, 8
Massachusetts, Maryland, New Jersey, New York, and Rhode Island reported the lowest suicide rates, averaging 9.3 per 100,000. These states had an average household gun ownership rate of 18.9 per 100 residents.4, 8
Despite higher gun ownership rates (55.8 per 100), Mississippi had a suicide rate of 14.8 per 100,000. Hawaii reports lower household gun rates (14.9 per 100 residents), with an average suicide rate of 14.5 per 100,000 that surpasses rates in 18 states with significantly more gun owners.4, 8
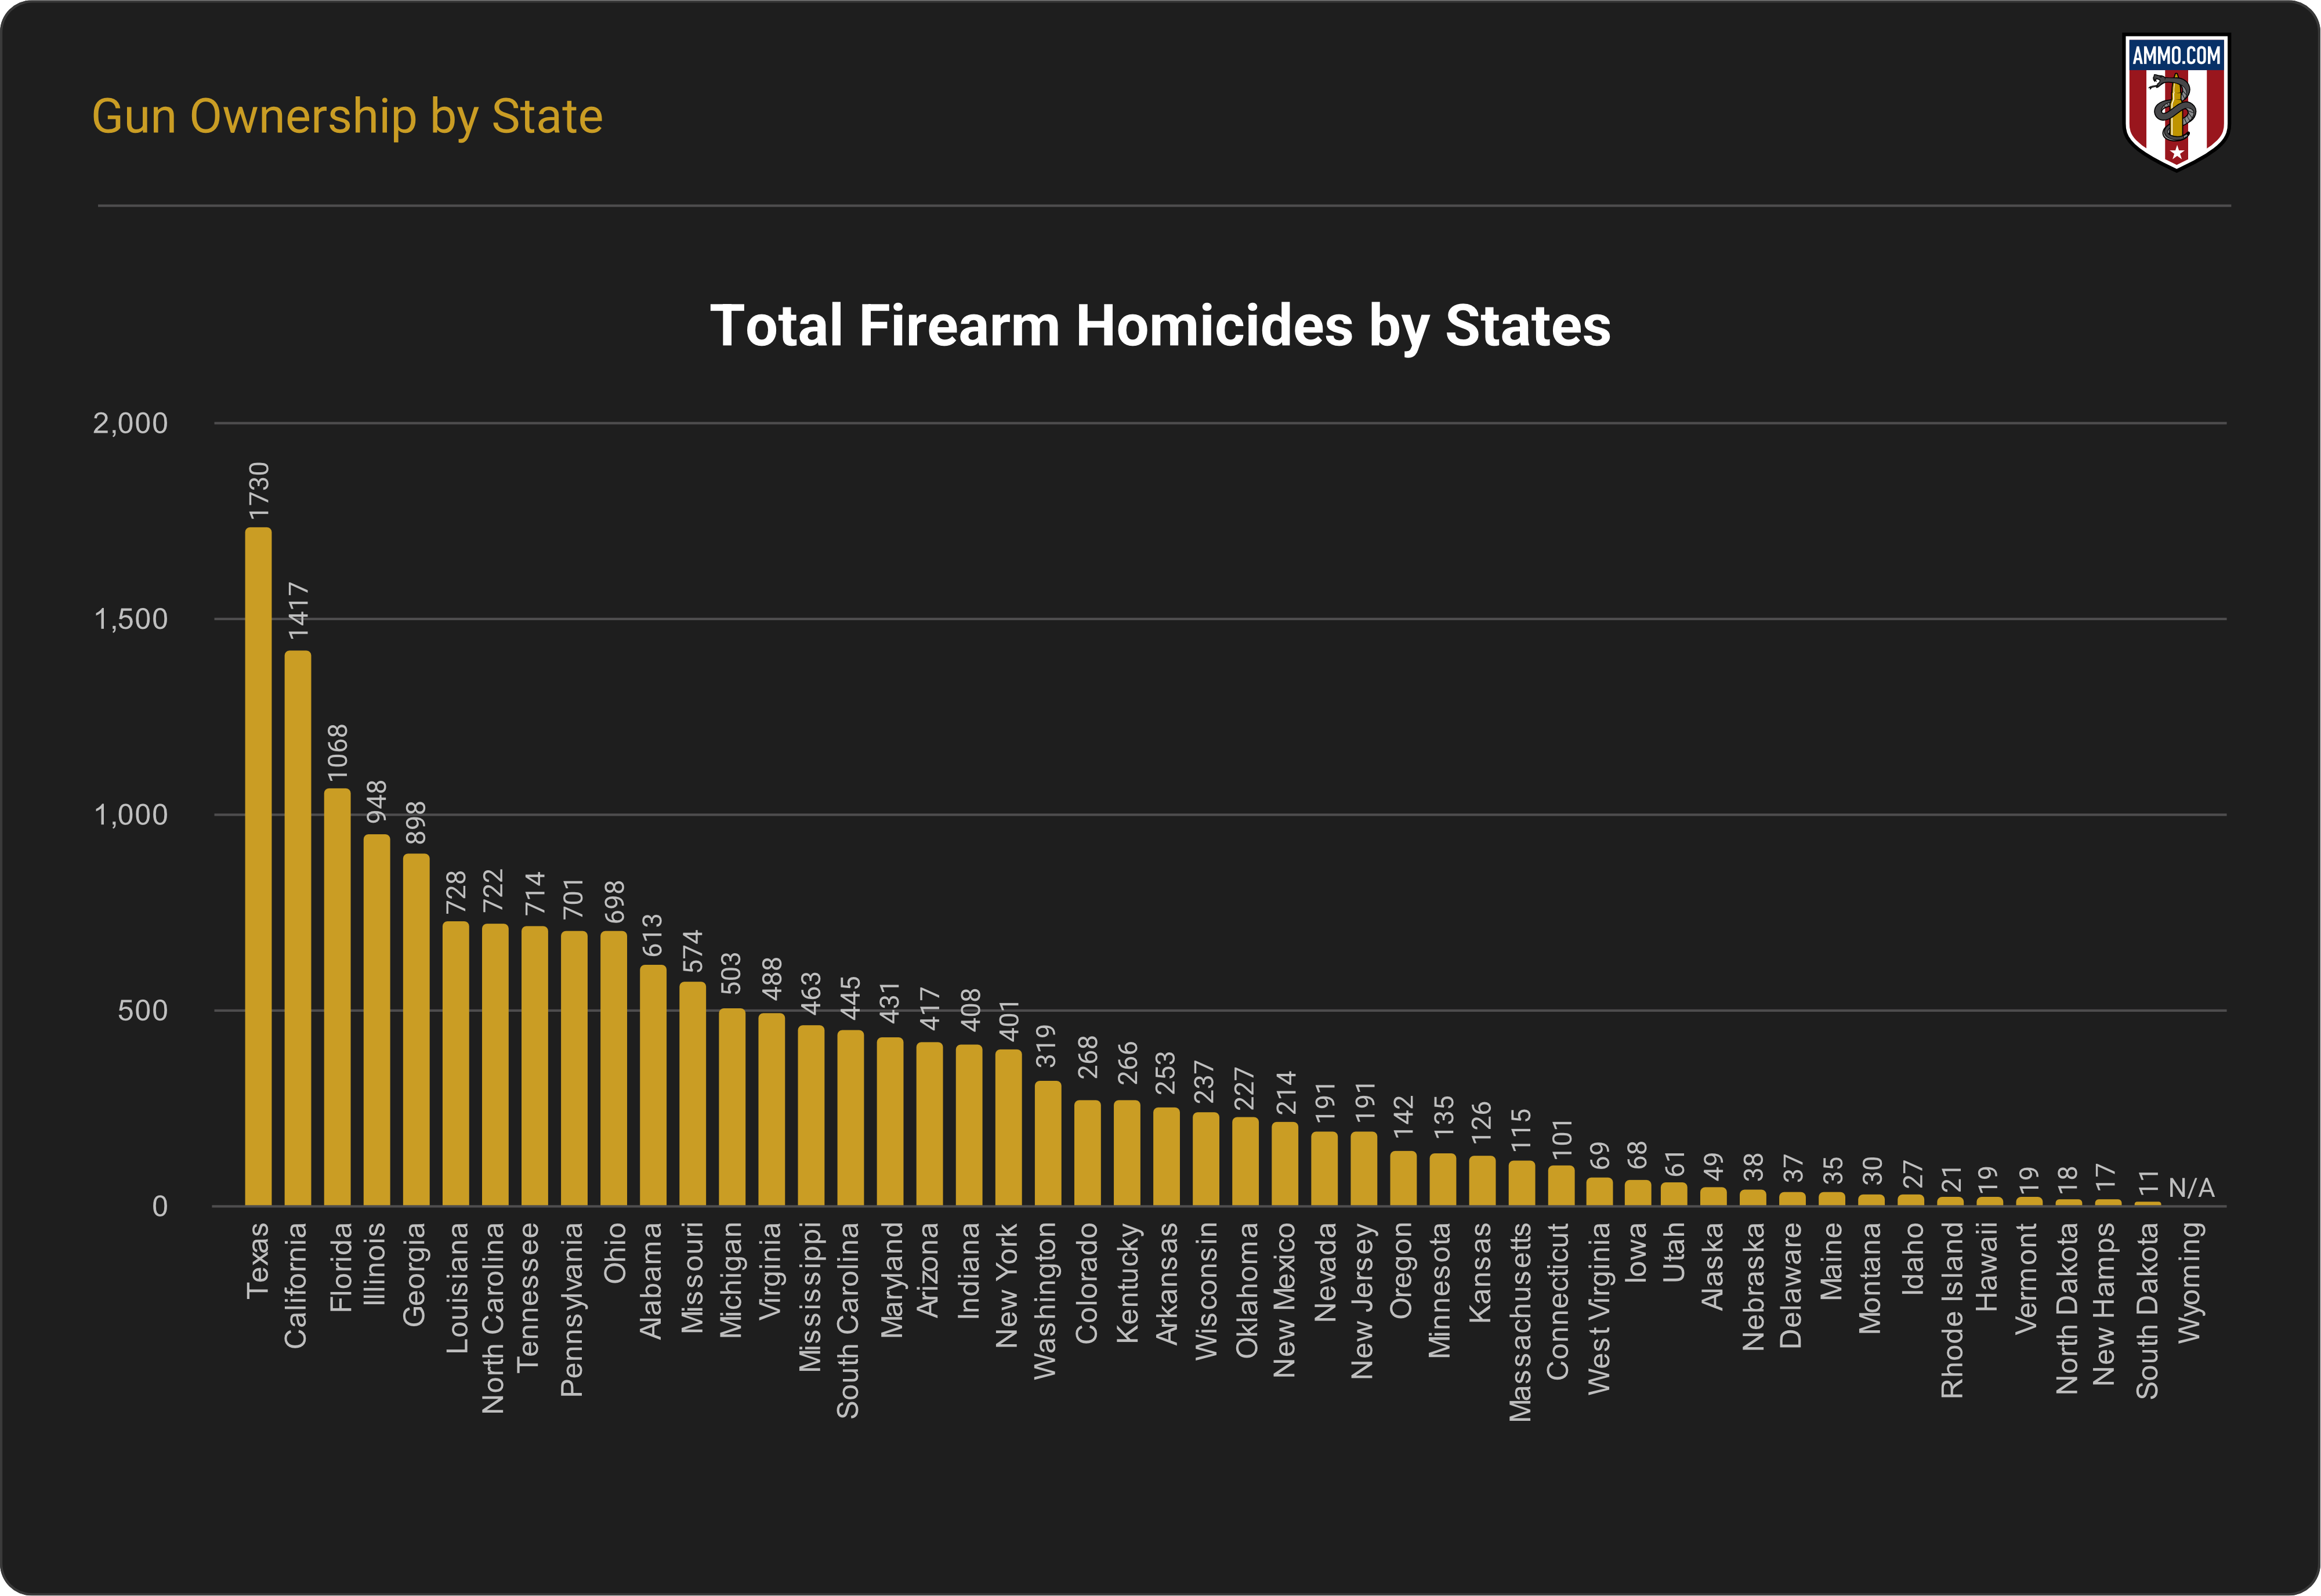
Firearm Ownership and Homicide Rate
Alaska, Idaho, Montana, West Virginia, and Wyoming report the highest average household gun ownership (63.1 per 100) and firearm-related homicide (4.9 per 100,000) rates. Alaska had the highest homicide rate of these states at 8.4 per 100,000. That increased the firearm-related homicide rate, as the remaining states shared an average of 4.0 per 100,000.4, 8
Hawaii, Massachusetts, New Jersey, New York, and Rhode Island report the lowest rates: an average of 15.8 guns per 100 households, and 3 firearm-related homicides per 100,000 people. Illinois and Maryland report lower firearm ownership (27.8 and 30.2 per 100, respectively), albeit higher homicide rates at 9.4 and 9.9 per 100,000.4, 8
Guns by State in the U.S.: Wrap-Up
The U.S. has more civilian-owned firearms than any other country, although ownership rates vary substantially from state to state. Whether we look at percentages, per capita rates, or totals, it becomes evident that gun ownership is much more prominent in some areas than in others. For the full national picture beyond the state breakdowns, see our deep dive into how many guns are in the US.
Sources
- Global Firearms Holdings 2017
- Gun Country: Gun Sales and Crime Statistics in the U.S.
- Gallup Historical Trends: Guns
- RAND Corporation: Gun Ownership in America
- Firearms Commerce in the United States: Statistical Update 2024
- Owner Responsibilities: Licensing (Giffords)
- Pew Research Center: Key facts about Americans and guns
- CDC WONDER: Underlying Cause of Death (2018-2024)
Article posted with permission from Ammo.com. Article by Cassandra McBride


