






Defensive Gun Use Statistics: Self-Defense Cases (2026)
Report Highlights: There are approximately 102 million gun owners in America. Of those, 0.5% to 2.5% report using firearms for self-defense every year.
- Studies and surveys from 1987 to 2025 suggest instances of defensive gun use range from 65,000 to 2.5 million each year.
- The most conservative defensive gun use estimate from the NCVS is 65,000 per year.
- According to recent surveys, 56% of gun owners state they carry firearms for self-defense.
Ammo.com provides reliable data from reputable sources. You can view all sources used in this article HERE.
Related Studies: How Many Gun Owners Are in America?, Guns in the Home Statistics, Why Do Americans Own Guns?
- Buy All-American!
- Bring health and vitality back to your body with these non-transdermal patches
- Get your Vitamin B17 & Get 10% Off With Promo Code TIM
- How To Protect Yourself From 5G, EMF & RF Radiation - Use promo code TIM to save $$$
- The Very Best All-American Made Supplements On The Market
- Grab This Bucket Of Heirloom Seeds & Save with Promo Code TIM
- Here’s A Way You Can Stockpile Food For The Future
- Stockpile Your Ammo & Save $15 On Your First Order
- Preparing Also Means Detoxifying – Here’s One Simple Way To Detoxify
- The Very Best Chlorine Dioxide
- All-American, US Prime, High Choice Grass-Fed Beef with NO mRNA, hormones or antibiotics... ever!
Methodology
“Defensive gun use” (DGU) has no single definition. Some researchers define DGU according to the shooter’s assessment of the situation. Others only apply it to shootings performed during the commission of violent crime.
This report covers a variety of sources and methodologies. DGUs were combined into two categories based on methodology.
Sources were categorized by definitions and defensive use factors as follows:
- Broad DGU – Surveys based on self-reports of brandishing a firearm, verbally warning an attacker, stopping a confrontation, or defensive display with no shots fired. These incidents may not be reported to the police, as there are no accompanying injuries or property damage.
- Narrow Crime-Based DGU – Officially reported incidents, in which a defender threatened an offender with the use of a firearm during a documented crime (e.g. robbery, assault, burglary with confrontation).
Federal databases, such as the FBI Crime Data Explorer and CDC WONDER, were referenced to analyze crime and firearm-related deaths. The National Crime Victimization Survey (NCVS) was referenced to analyze defensive use cases based on reported crimes.
Per capita rates are calculated using U.S. population estimates ranging from 319 to 339 million.
How Often Are Guns Used in Self-Defense?
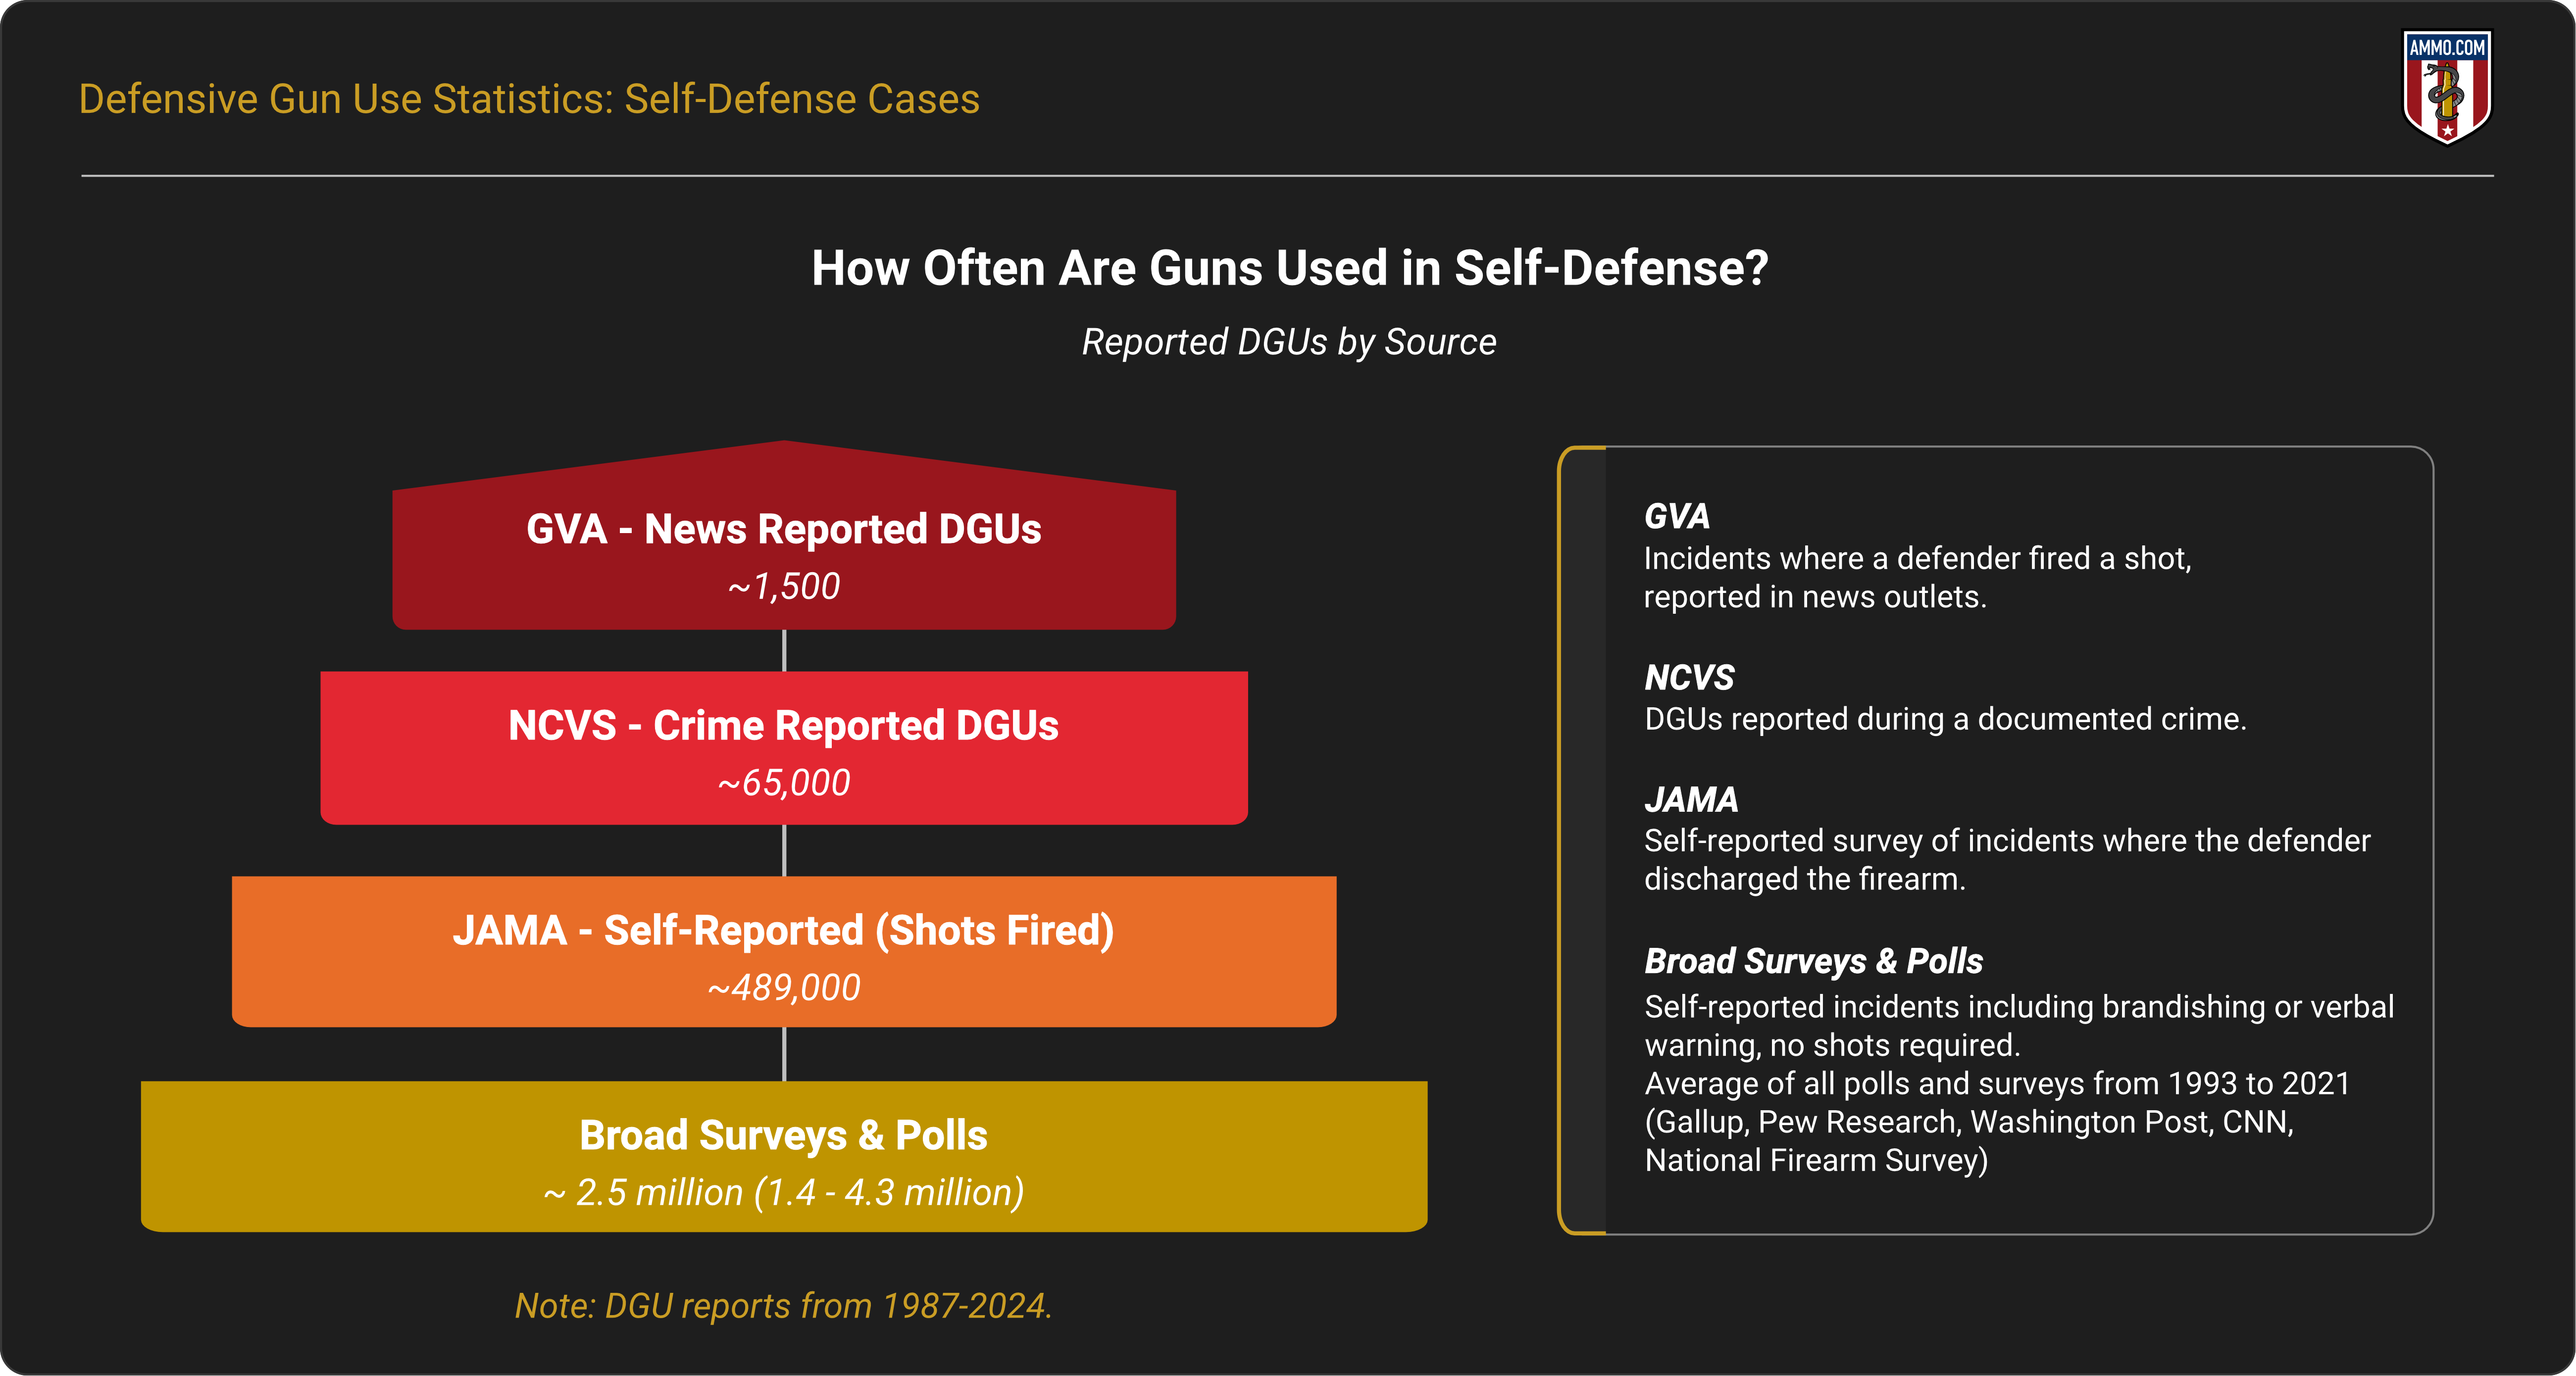
DGU estimates vary depending on source and methodology. Studies and surveys between 1990 and 2023 consistently suggest there are between 60,000 and 2.5 million DGUs annually (18-750 uses per 100,000 people).7
A survey-based study published in JAMA Network Open in March, 2025 estimated 489,000 annual DGUs in which a firearm was discharged. These incidents included a defender firing at and/or in the vicinity of a perceived threat.1
Self-reported survey data suggest that an average of 750 people per 100,000 deter or stop a criminal with a firearm annually.16
Crime-based reporting studies suggest that between 18 to 30 people per 100,000 stop a threat and report it to the police annually. These data do not include all DGUs because they are based on reported crimes, and a DGU indicates that a crime was thwarted.3
Polls and self-reporting surveys over the past thirty years range from 1.4 million to 4.3 million DGUs annually. These polls and surveys include respondents’ grabbing a firearm due to a perceived threat. These sources include incidents of brandishing, displaying, verbally warning with a gun in hand, or firing a weapon at a potential threat.18
The Gun Violence Archive (GVA) reported 18,414 DGUs (1,534.5 on average per year) between 2014 and 2025. This database uses more than 7,000 publications to identify incidents in which a shot was fired defensively and reported to the police and news outlets.6, 15
Justifiable Homicides in the U.S.
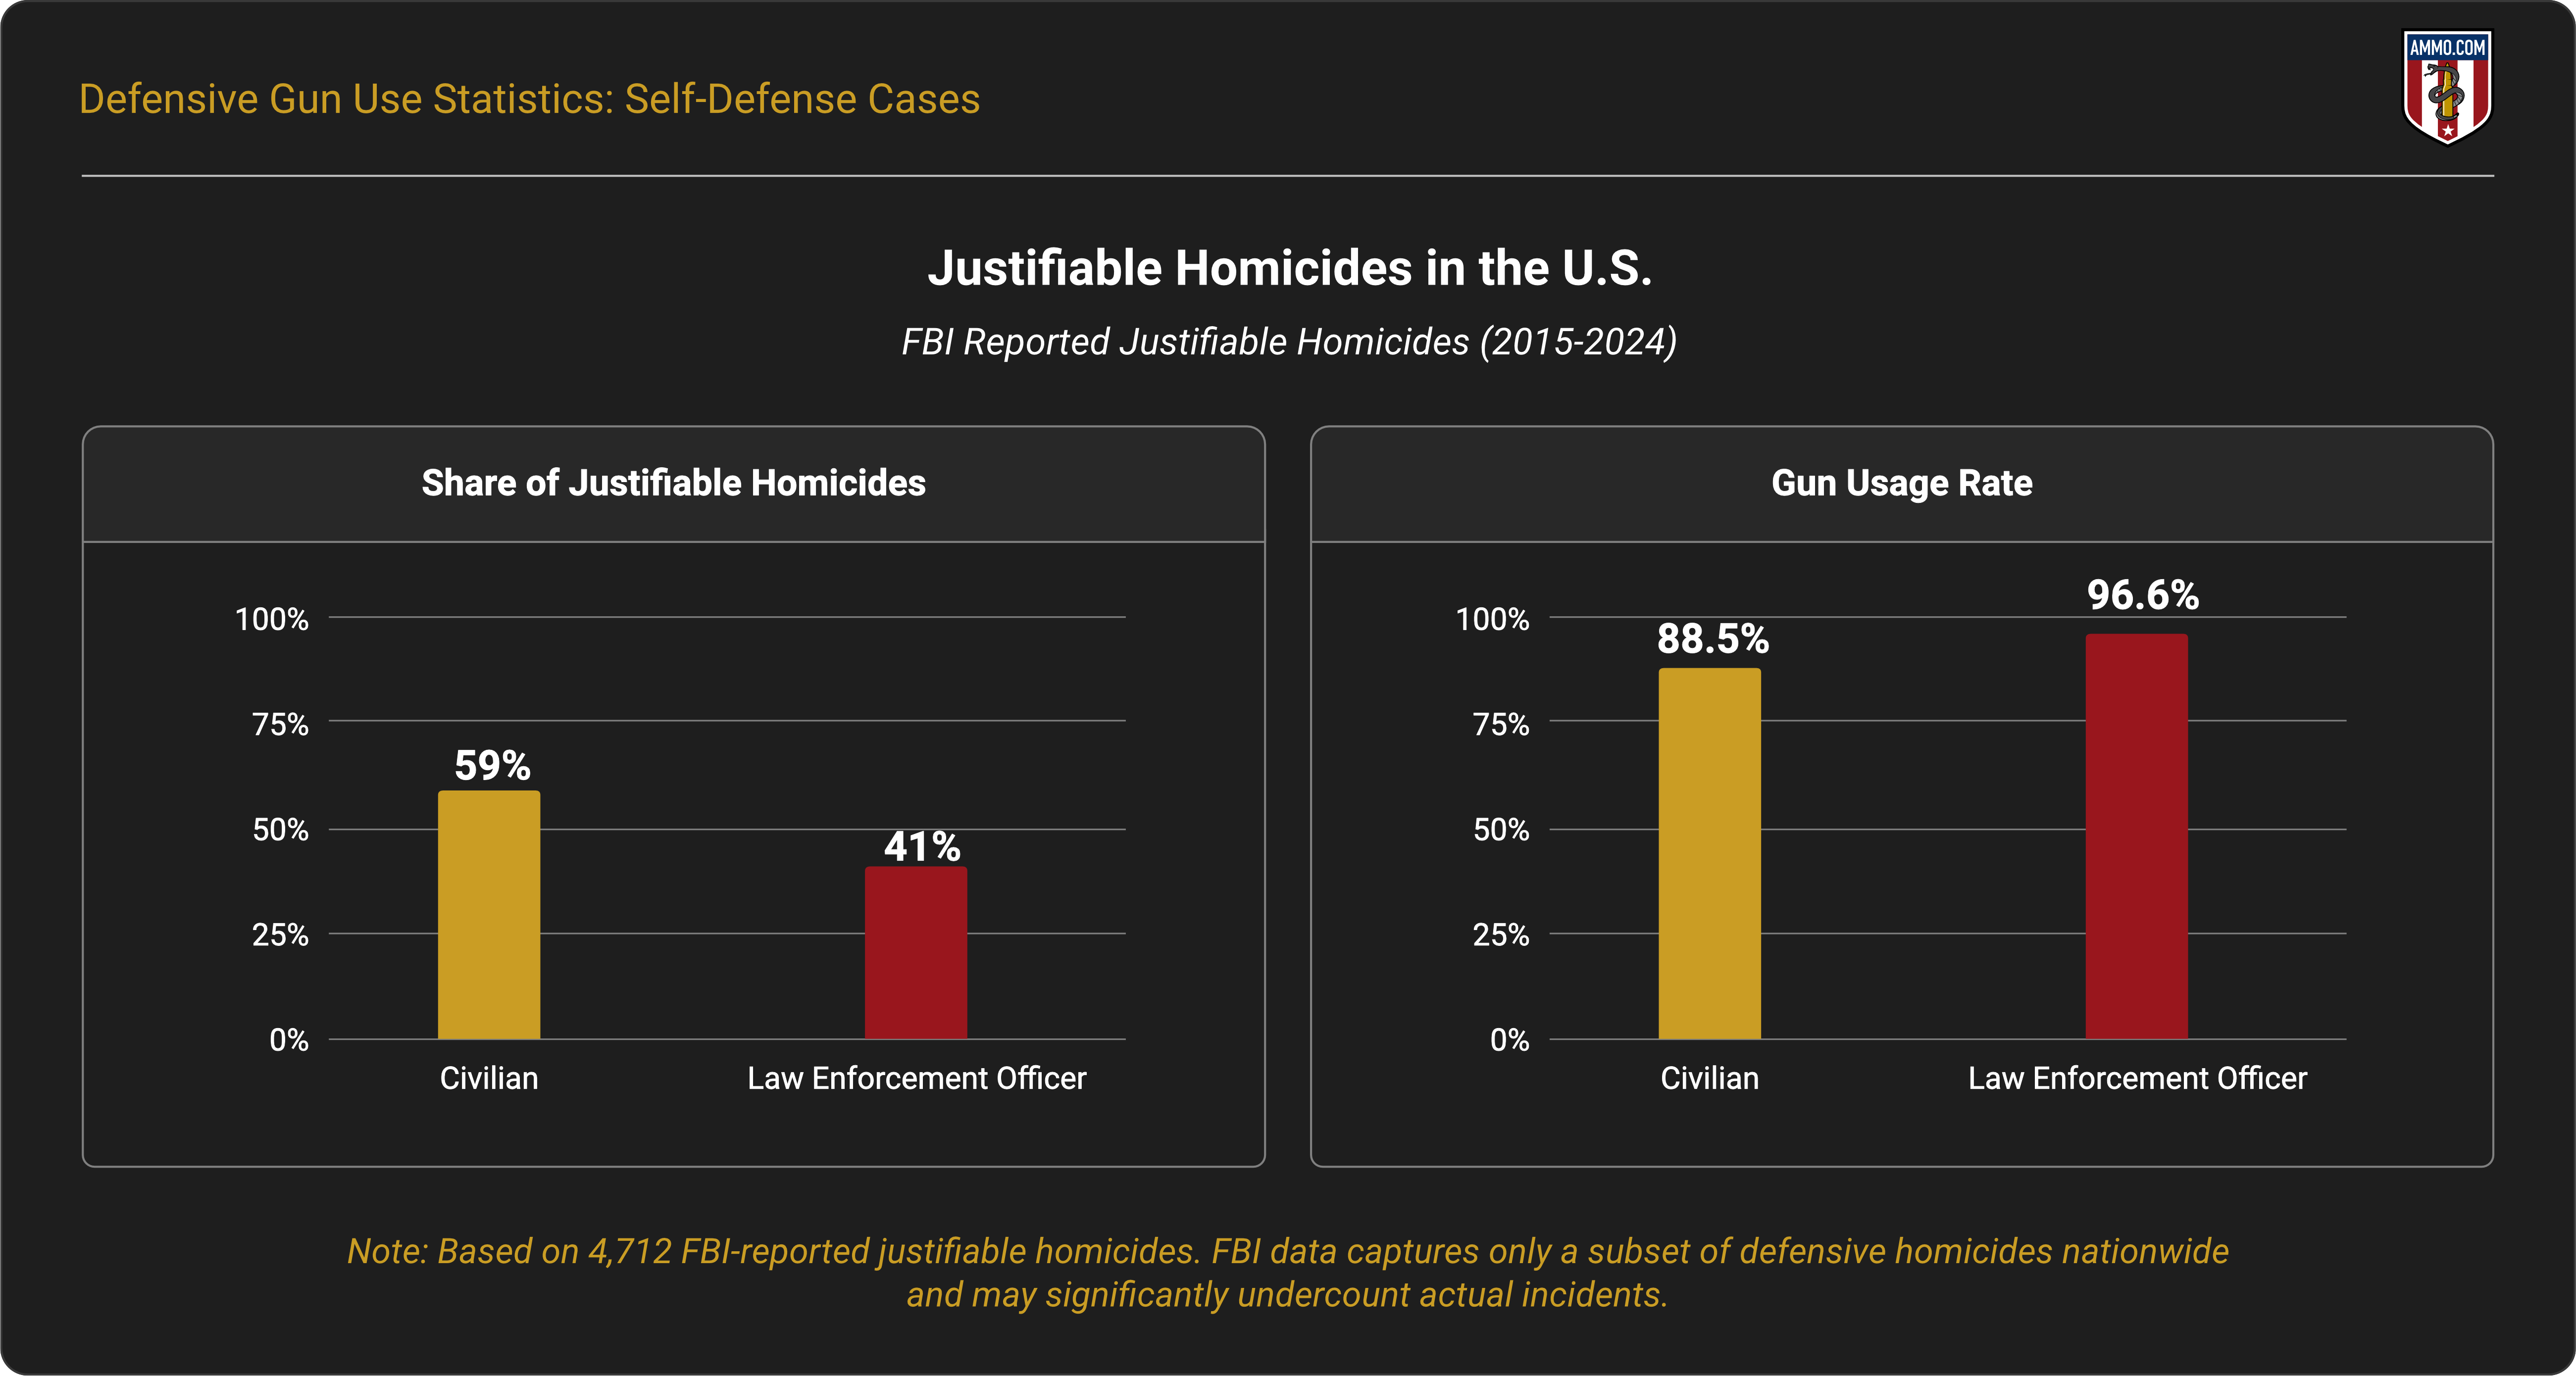
Justifiable homicides in the U.S. are defined as the lawful killing of another person. The FBI tracked 4,712 cases of justifiable homicide between 2015 and 2024. Of those, 59% of cases involved a civilian stopping a threat, and 41% involved a law enforcement officer stopping a threat.8
Note: The FBI’s justifiable homicide data capture only a small subset of self-defense homicides. These incidents are classified and reported by law enforcement agencies nationwide. They do not represent the total number of defensive homicides in the U.S.
Justifiable Homicide by Region
Of the 4,712 justifiable homicides reported by the FBI between 2015 and 2024, 54% (2,552) occurred in the South. The Midwest reported 22.2% of the nation’s justifiable homicides, followed by the West with 17.5% (824), and the Northeast with 6% (289).8
Civilian and Law Enforcement Justifiable Homicides
Nationwide, civilians committed 59% of justifiable homicides, law enforcement, 41%.
Law enforcement officers were more likely to use guns (96.6%) than civilians (88.5%) during these incidents. Civilians were more likely to defend themselves from someone they know (44% vs. 11%), whereas law enforcement officers were more likely to defend themselves from a stranger (88% vs. 55%).8
Between 2015 and 2024, most of the civilian justifiable homicides (63%) and law enforcement justifiable homicides (41%) were reported in the South.
Concealed Carry and Defensive Use Statistics
A 2021 National Firearms Survey suggests there are 1.67 million DGUs annually. This survey also reported that 56% of gun owners state they carry firearms for self-defense purposes. Only 35% (just over 35 million people) reported carrying their firearms outside the home regularly.12
The survey also suggests that 26.3% of gun owners conceal carry a handgun. An additional 35% reported refraining from carrying due to concealed-carry restrictions.12
How Many Crimes Are Stopped by Guns?
There are no exact figures for how many crimes are stopped by guns each year, but available data provide estimates ranging from 60,000 to 2.5 million annual incidents.7
Studies have reported a range of findings, including decreases, no measurable effect, and increases in crime when gun laws are more permissive for law-abiding civilians. A comprehensive review by the RAND Corporation found that results vary across studies. There is no single consensus on how many crimes are stopped by guns in the U.S.4, 14
Early research published by the University of Chicago suggested that 1,570 murders, 4,177 rapes, and 60,000 aggravated assaults could have been prevented annually between 1977 and 1992 had concealed carry laws been more relaxed.13
Defensive Gun Use and Violent Crime Statistics
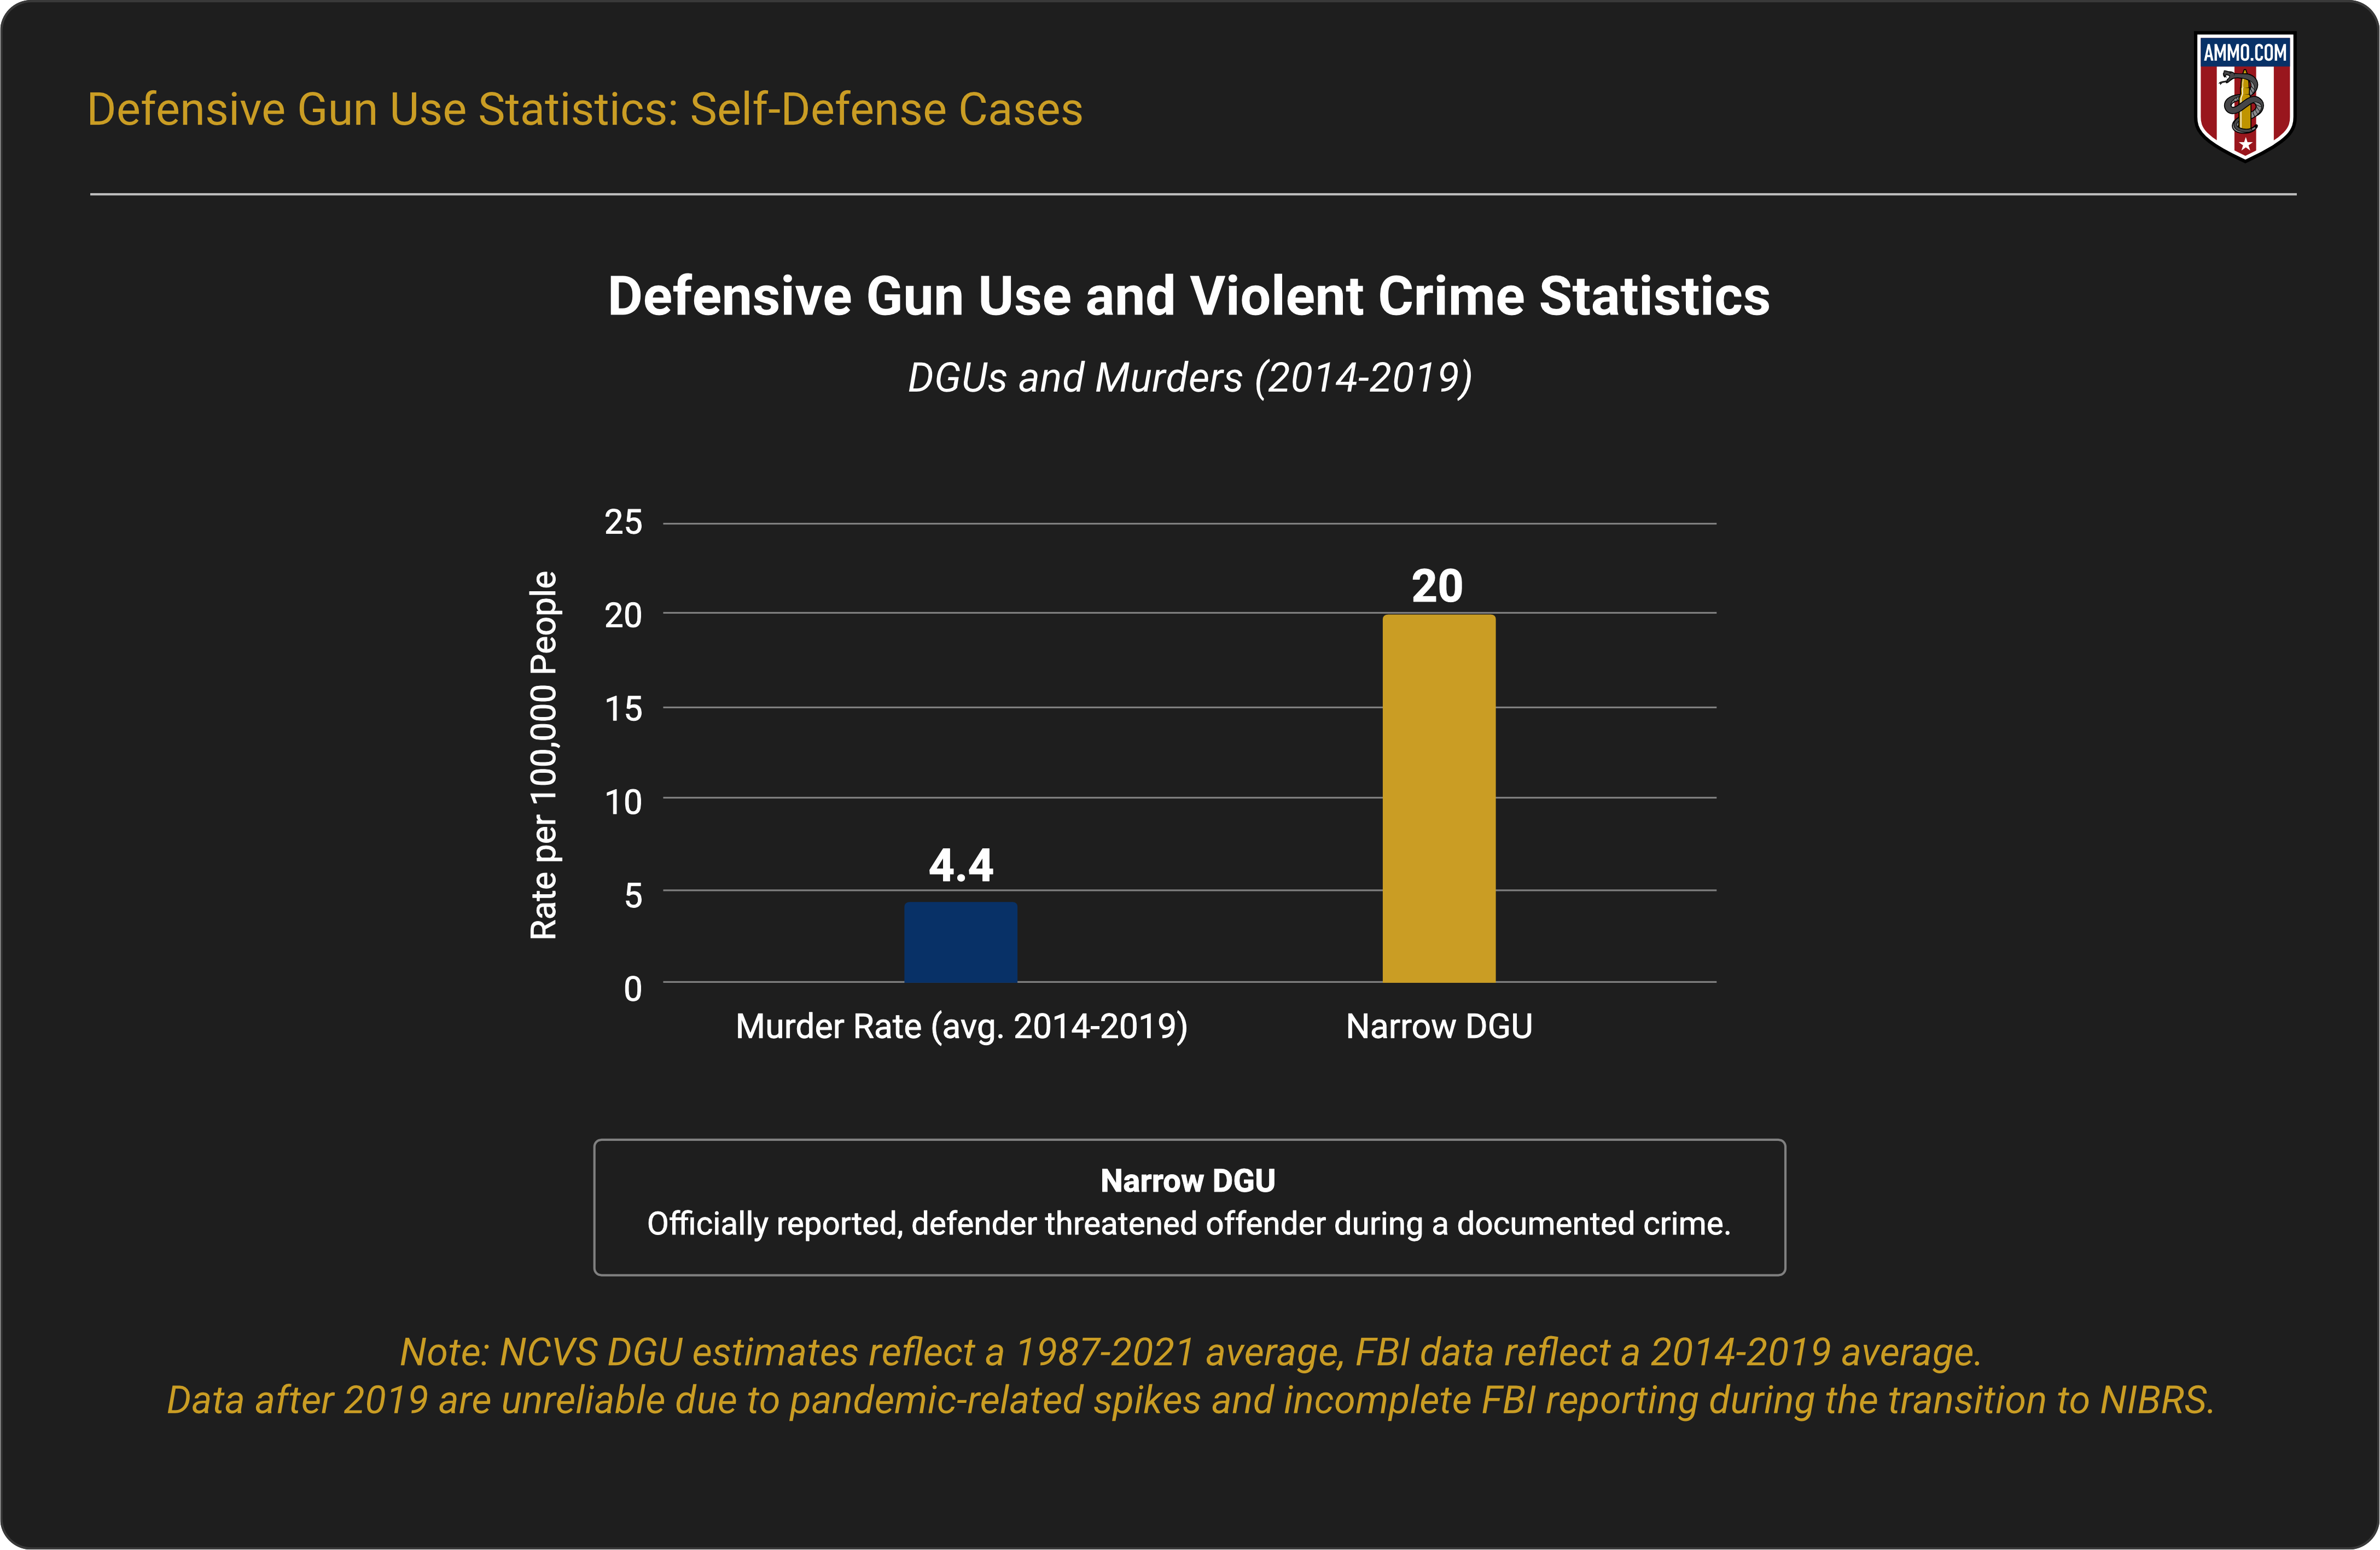
NCVS data from 1987 to 2021 suggested an average of approximately 65,000 DGUs annually (20 per 100,000 people).17
The NCVS recorded approximately 10 million nonfatal violent assault victims who took some form of protective action (e.g., running away, calling for help, reasoning with the attacker, self-defense methods) between 2014 and 2018.11 The FBI recorded 14,220 murders on average between 2014 and 2018; an average annual rate of 4.41 per 100,000 people.9, 10
In 2024, the CDC reported 44,447 firearm-related deaths, of which 15,364 were homicides (4 per 100,000 people). Using crime-based DGU estimates (60,000 to 100,000 annual incidents), the rate of DGUs annually is 18 to 30 per 100,000.2
Note: CDC WONDER database homicide counts include justifiable and negligent homicides. Actual murder rates are lower than displayed. FBI data are based on agency reporting and may undercount actual incidents. NCVS data are collected through surveys that include incidents of self-defense during the reported commission of a crime.
What Is the Distance of Most Defensive Shootings?
According to the FBI, the average distance of a defensive shooting is 3 yards.5
Average Number of Shots Fired in Defense
According to the FBI, an average of three shots are fired per defensive shooting.5
Wrap-Up
DGUs in the U.S. aren’t well-tracked and recorded. Self-report survey data and peer-reviewed studies suggest that DGUs occur frequently, yet they are rarely captured by official crime statistics.
The effectiveness of DGUs on stopping perceived threats is challenging to quantify due to reporting issues. Not all DGUs are reported to law enforcement, and law enforcement may not report all DGUs to larger databases (such as the FBI’s).
Sources
- Lifetime and Past Year Defensive Gun Use
- CDC Wonder Underlying Cause of Death 2018-2014
- Crime Victimization in the United States, 1994
- Effects of Laws Expanding Civilian Rights to Use Deadly Force in Self-Defense on Violence and Crime: A Systematic Review
- Distance & Shots Fired
- Defensive Gun Uses
- Gun Threats & Self-Defense Gun Use
- Justifiable Homicide: 2015-2024
- 2019 Crime in the United States
- 2014 Crime in the United States
- Trends and Patterns in Firearm Violence, 1993 to 2018
- 2021 National Firearms Survey: Updated Analysis Including Types of Firearms Owned
- Crime, Deterrence, and Right-to-Carry Concealed Handguns
- Effects of Concealed-Carry Laws on Violent Crime
- Past Summary Ledgers: Gun Violence Archive
- Defensive Gun Use: Vengeful Vigilante Imagery Versus Reality: Results from the National Self-Defense Survey
- The incidence of defensive firearm use by US crime victims, 1987 through 1990
- What Do CDC’s Surveys Say About the Prevalence of Defensive Gun Use?
Article posted with permission from Ammo.com. Article by Cassandra McBride